South Africans forced to go on a diet
Using economic data we show how South Africans have collectively gone on diet, induced by the descent of consumer wealth in South Africa.

Using economic data we show how South Africans have collectively gone on diet, induced by the descent of consumer wealth in South Africa.
It makes intuitive sense that, all other things equal, the volume of food and grocery sales in a country, should grow roughly in line with the population growth rate. Higher sales relative to population growth suggests wealth gains and increasing consumption per person, while fewer sales suggests increasing poverty and lower consumption per person.
To fully capture the volume of SA consumers’ total spend on food and groceries, we combine the real retail sales of food and groceries with the real sales of restaurants and takeaway outlets.
The trend in the table below clearly depicts South Africans’ ‘collective diet’ induced by the descent of consumer wealth in South Africa.
2004-2009: Jacob Zuma took office in May 2009, enjoying the tailwinds of the buoyant economic growth rate of almost 5% per annum in the preceding five years. Food and grocery sales volumes grew ahead of the population growth rate reflecting the increased consumption of the rapidly growing middle class, fuelled by real income growth (as represented by GDP per capita).
2009-2014 and 2014-2019: It didn’t take long for Jacob Zuma’s patronage network and economic mis‑management to slash South Africa’s economic growth rate and with that, usher in a decline in the real GDP per capita and the first decline in the middle‑class population since the brief blip in 2009 after the global financial crisis (GFC). Households collectively tightened their belts and food and grocery sales volumes matched the growth in the population.
2019-2021: Unlike his predecessor, Cyril Ramaphosa inherited a flagging economy when he took office in February 2018 and to make matters worse the Covid-19 pandemic hit the country in 2020. What’s clear from the data below is that in the midst of the deteriorating economy and the pandemic over the past three years, the collectively poorer South African consumers have literally been eating less, as depicted by the fact that food and grocery sales volumes are lower than the population growth rate.
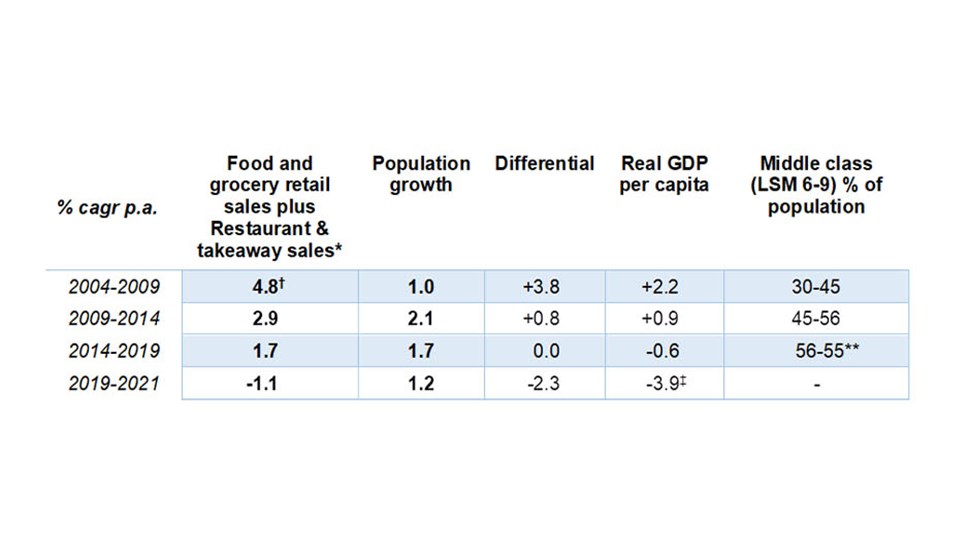
Sources: Statistics SA, SA Reserve Bank, South African Audience Research Foundation (SAARF), Sasfin Wealth *For ‘Food and grocery retail sales’ we added the General Dealers and Specialised Food and Beverage retailers categories from the Statistics South Africa retail sales data. General dealers includes the national food and grocery chains such as Pick n Pay and Shoprite while Food and beverage stores include bakeries, butcheries and green grocers such as Food Lovers Market. For ‘Restaurant and takeaway sales’ we added the Restaurant & Coffee Shops and Takeaway/Fast Food Outlets data from the Food and Beverages release from Statistics SA. † Total real retail sales ‡ 2019-2020 ** Survey terminated in 2015, although it is notable that in the last survey in 2015, the middle class had reduced as a percentage of the total population from 55.5% to 54.7%.