We are living in a material (digital) world
Sasfin Quarterly Review – March 2021. The MSCI All Country World Index returned close to 5% for the first quarter.

Sasfin Quarterly Review – March 2021. The MSCI All Country World Index returned close to 5% for the first quarter.

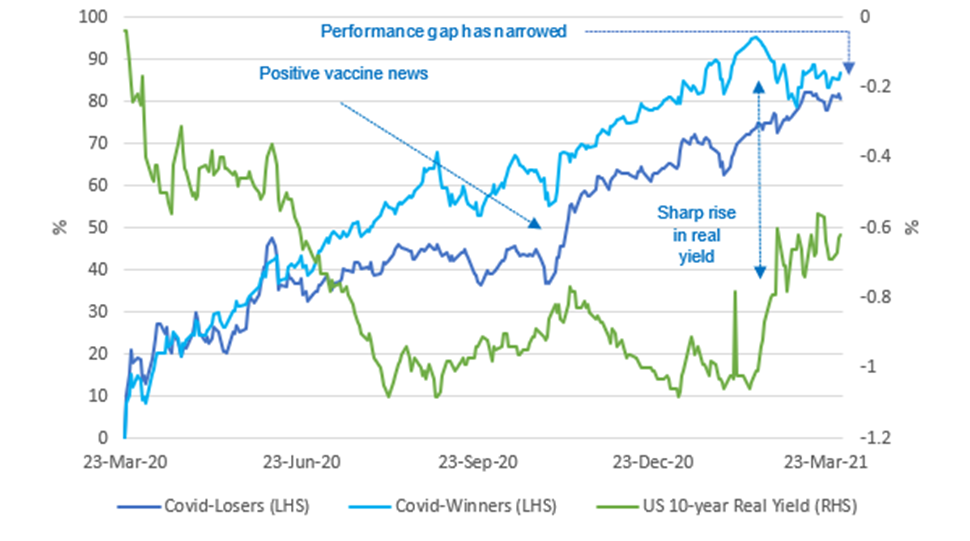
A little over a year ago, a nadir was reached following the onset of the global pandemic which led to a collapse in global equity markets. It is worthwhile looking back in time to better understand how various sectors have performed and contributed to the recovery we have seen thus far. As markets bottomed out, the initial recovery was propelled by stocks in the information technology, consumer discretionary and communication services sectors. These sectors can be referred to as the “Covid-Winners” and include stocks such as Apple, Amazon, Microsoft and Netflix – all stocks that benefited under a work-from-home environment. During this same period, we saw underperformance by the energy, financial and industrial sectors. These sectors can be referred to as “Covid-Losers” and include companies involved in oil and gas, banking, insurance, and of course those involved in the production and manufacturing of goods – stocks that are relatively more sensitive to changes in economic growth.
As we headed into the final chapter of 2020, the positive news surrounding vaccines coupled with significant fiscal stimulus support led to a change in leadership whereby the so-called Covid-Losers began to outperform and this trend has continued into the first quarter of 2021. The MSCI All Country World Index (“MSCI ACWI”), a broad measure of global equity markets, returned close to 5% for the first quarter of 2021 with the Covid-Losers continuing to lead markets higher. In fact, the performance gap between the winner and loser sectors has narrowed substantially. Rising expectations of future economic growth, underpinned by the rollout of the vaccines and pent up demand, have begun to reflect in longer term interest rates, more specifically the “real” rate of interest. The US 10-Year Real Yield, which strips out the impact of inflation on interest rates, rose sharply in February and many of the Big Tech stocks located in Covid-Winner sectors were negatively impacted by the increase which in turn amplified the outperformance of their loser counterparts. Big Tech stocks which are long-duration growth stocks (stocks expected to deliver a higher proportion of future cash flows in the distant future) are more sensitive to changes in longer-term interest rates, specifically real rates.
Covid-Winners vs. Covid-Losers: Cumulative Returns
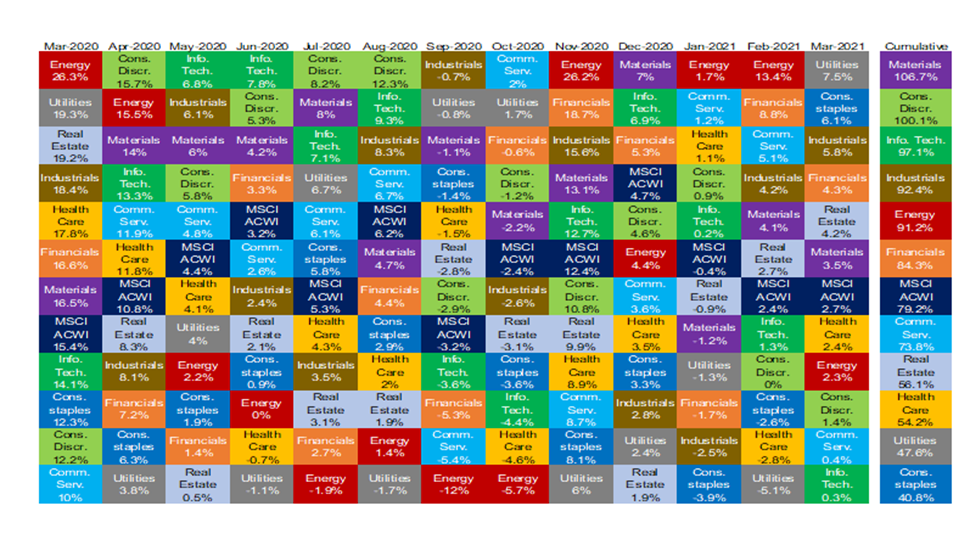
What may come as a surprise to many is that the best performing sector following the market lows of March last year has been the materials sector. The materials sector includes commodity-based companies such as those associated with mining, steel production, the manufacture of chemicals, construction materials and various packaging (paper, glass etc.) products.
MSCI ACWI Sectors - Total Returns
Following the bottoming out of markets on the 23rd of March 2020, we have seen a tremendous rise in commodity prices. Starting with metals, price increases in tin (+94%), copper (+92%), iron ore (+88%), cobalt (+72%), zinc (+54%), nickel (+46%) and aluminium (+44%) have been significant. Platinum group metals, which are used in catalytic convertors by automakers, have also increased significantly with rises in palladium (+54%), platinum (+84%) and rhodium in particular shooting up a whopping 337%.
One metal that has not kept pace after its initial rise during 2020 has been gold. The yellow metal which broke the $2,000/ozt level last year has fallen back since, closing the quarter slightly above the $1,700/ozt level, a return of 10% since market lows in March of last year. Gold, which is often viewed as a safe haven during uncertain times, has lost a bit of its shine in the wake of economic growth prospects backed by the rollout of vaccines and stimulus packages. In addition, gold does not offer an income and with the real yield increasing, the opportunity cost of holding gold has increased.
Physical gold may also be suffering at the hands of “digital” gold. Cryptocurrencies have surged since central banks adopted more accommodative policies which have seen their balance sheets balloon and interest rates plummet to historically low levels. Concerns over these developments, as well as growing acceptance of cryptocurrencies, is a likely reason for investors substituting gold for the likes of Bitcoin and Ethereum with their respective prices skyrocketing by 898% and 1,394% since March of last year. Despite its growing acceptance, many still believe that cryptocurrencies are in “bubble”, sighting no fundamental value behind the digital assets. Sceptics believe the accommodative monetary environment and low interest rates have led to funds flowing into risky assets, with “digital assets” in particular being a key beneficiary. The perceived frothiness surrounding the crypto movement will have been elevated following the sale of a digital collage of images, commonly referred to as a non-fungible token (NFT), for $69 million. To be more precise, a non-fungible token is a unit of data on a digital ledger called a blockchain, where each NFT can represent a unique digital item, and thus they are not interchangeable. NFTs can represent digital files such as art, audio, videos, items in video games and other forms of creative work. For those that are unconvinced or even confused, the Sistine Chapel is still around.

Energy price increases have been even more significant than those in metals. In particular, the price of Brent crude, which was dwindling around $20 a barrel last year, has risen by over 150% even reaching $70 before settling down to end the quarter at slightly above $60 a barrel. Optimism surrounding economic growth prospects, which is being driven by vaccine rollouts, has been the predominant catalyst behind the oil price recovery. With such a recovery firmly in back of mind, the OPEC+ alliance, which includes Saudi Arabia, intends to increase production output by 350,000 barrels a day from May this year. This is a swift reversal from their previous action in January which was to reduce production by one million barrels a day.
One element which may also be contributing to the rise in commodity prices is the disruption seen in global supply chains. The disruptions experienced can however be split into two distinct phases. Last year, the disruptions encountered could be attributed to Chinese factories that were shutdown, essentially production constraints. The more recent disruptions however are related to transportation issues rather than production constraints. During the initial stages of the pandemic, manufacturers opted to cut back on production as they anticipated that incomes and spending would fall, as per normal with recissions, but the opposite has occurred with incomes surging due in large part to fiscal support. In addition, spending on goods picked up as households had more cash on hand than usual to spend on consumer goods as they were unable to spend on consumer services which were largely unavailable. With manufacturers not anticipating this surge they in turn had not ordered enough inputs and parts to meet rising demand. Compounding the issue is the fact that even if international manufacturers were able to produce goods, the virus was also weighing on international shipping. A combination of high demand and limited supply for international shipping has led to a shortage of containers as well as port congestion resulting in shipping delays. This goes a long way to explaining most of the recent supply chain disruptions but the winter storm that blew through Texas during February and the Ever Given container ship getting stuck in the Suez Canal, blocking it for almost a week, did not help.

One factor that is influencing equity market movements more so than usual is the growing impact of the retail investor (trader). It first started in late 2019 with retail brokerages introducing zero-commission trades. This was later followed by the global pandemic which saw hordes of individuals forcibly stuck at home with little to do in the form of betting or gambling. Online platforms such as Reddit or even Facebook and Twitter created a haven for these individuals to “gather” and discuss stocks (bets). The culmination of events took place with retail investors taking on the mighty hedge funds of Wall Street as the two forces battled over stocks such as GameStop. Today it is estimated that retail investors account for 20% to 30% of all US stock market trading, more than twice the level of their participation in 2019, making them the second largest participant in the US equity markets after high-frequency traders in terms of trading volumes.
The pandemic has also created a fertile environment for investment bankers. The Financial Times recently reported that global dealmaking hit a record in the first quarter of 2021 reaching its highest level in over four decades as the value of deals topped $1.3 trillion. Much of this M&A activity has been fuelled by “SPACulation” which has grown in size since the onset of the pandemic. Special Purpose Acquisition Companies or SPACs are what are commonly referred to as blank-check companies. Simplistically, a SPAC is a shell company (it has no operations) that will raise money and list on an exchange with the intention of acquiring or merging with another company, typically private in nature. Year to date, SPAC deals in the US reached over $170 billion and accounted for more than a quarter of M&A activity in the US.
In the US, the S&P500 Index breached the 4,000 level for the first time in its history with the market returning roughly 6% for the quarter. In particular, US banking stocks delivered strong returns over the quarter with rising interest rates and the resumption of share buybacks among the key catalysts. US oil and gas producers have been buoyed by rising oil and gas commodity prices and the US Energy sector returned 30% during the first quarter. It was only a few weeks ago that the US Congress approved a $1.9 trillion fiscal stimulus plan to support the economic recovery but President Biden has now unveiled his much anticipated $2.3 trillion infrastructure spending plan. Under this plan $620 billion in spending will go towards transportation efforts which include the upgrading of roads, bridges and other modes of public transport. The transportation spend also includes an allocation of $174 billion towards electric vehicles and incentives related thereto with a target to build a national network of 500,000 electric vehicle charging stations by 2030. Around $300 billion will be allocated to manufacturing with particular focus on bolstering the domestic semiconductor industry as well as clean energy. Other areas of spend include job creation and research ($280 billion), education ($137 billion), upgrading of utilities and related power grids ($266 billion), and building upgrades to address energy efficiency, water infrastructure and affordable housing options ($286 billion). The size of this package is enormous and to pay for these upgrades the US President has proposed increasing corporates taxes by increasing the corporate tax rate from 21% to 28%, effectively replacing the tax changes introduced by the Trump administration four years ago. The proposed spending is expected to take place over the next ten years whereas the tax increases would be phased in over a period of fifteen years. The infrastructure proposal is likely to face significant hurdles in the form of Republication, and possibly centrist Democrats, opposition to corporate tax rates increasing as well as the size of the package which might ultimately see the package scaled down as well as a reduction in the proposed tax increases.
Other global equity markets had positive returns for the quarter as the Japanese TOPIX Index and the STOXX Europe 600 Index both returned 8%. However, one of the best performing equity markets during the quarter was the local bourse as the JSE All Share Index returned more than 10% during the first quarter. Much of the strong performance can be attributed to the soaring commodity prices which have benefited diversified mining groups (Anglo American, BHP and Glencore), platinum miners (Anglo American Platinum, Impala Platinum, Northam Platinum and Sibanye Stillwater), as well as oil and gas producer Sasol.