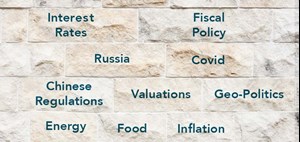
Between a rock and a hard place
Global equity markets endured a challenging quarter that included the Russian invasion of Ukraine and the commencement of an interest rate hiking cycle by the US Federal Reserve (“Fed”). The combined effect led to the MSCI All Country World Index (“MSCI ACWI”), a broad measure of global equity markets, declining by more than 5% during the quarter.
We were only a few days into January when equity markets began to fall as investors started to price in the possibility of the Fed increasing interest rates in an effort to reel in red-hot levels of inflation. In general, equity prices and the direction of interest rates have an inverse relationship. The theory goes that the fundamental value of a company’s equity, as well as other assets for that matter, is based on the value of the future cash flows that are expected to be generated by the company discounted back to the present day. Higher interest rates increase the rate at which those cash flows are discounted and consequently reduce the value of those future cash flows.
Global equity markets were pushed down even further following the invasion of Ukraine by Russia. All things considered, the decline in equity markets for the quarter does not seem too bad. Around mid-March, the MSCI ACWI was down 13% but in a move that might seem counterintuitive to a recovery in equity prices, when the Fed did eventually raise interest rates, equity markets began to recover.
This may seem counterintuitive as not only did the Fed raise interest rates by 25 basis points but it also noted that this increase was the first in a series of future rate hikes which could even include increments of 50 basis points at a time. Perhaps equity investors were expecting a more aggressive approach from the Fed. It is however worth noting that the Fed has become increasingly hawkish – more concerned about rising inflation as opposed to employment and economic growth. US inflation, which does not even include the impact of rising energy, food or housing prices, reached a four-decade height of 7.9%. The market’s reaction to the announcement by the Fed was somewhat surprising as US equities clawed back some of the losses from earlier in the quarter helping the S&P500 Index, a broad measure of US equity markets, to “only” end the quarter down a little below 5%.
While the Fed raised its benchmark federal funds rate by 25 basis points, the longer-term 10-Year US Treasury saw its yield rise from 1.51% at the start of the year to close the quarter at 2.38% as bond investors priced in future interest rate increases. The pathway to a higher long-term rate was met with some resistance as investors piled into safe-haven assets, such as US treasuries, following the Russian invasion which ended up pushing the yield on the 10-Year Treasury lower. There is an inverse relationship between the price of bonds and their yield. As purchases of bonds increase, bond prices begin to rise whereas the yields on the bonds decline, as was the case from the onset of Russia’s military action. The fall in yield was however short-lived following the announcement by Fed chair, Jay Powell, that despite negative consequences likely to ensue from the Russia-Ukraine war, the Fed would still go ahead with its intended action of raising interest rates.
Something that has begun to create a stir among market participants has been a convergence in yields of the shorter-term 2-Year US Treasury and its 10-Year counterpart – a phenomenon referred to as “yield curve flattening”. What really set the cat amongst the pigeons, was when the yield on the 10-Year treasury briefly fell below that of the 2-Year – an event referred to as an “inversion of the yield curve”. Ordinarily, longer term instruments command a higher yield as investors require a “term” premium for holding the instrument due to the uncertainty that comes with holding an instrument for a longer period of time. An inverted yield curve is often viewed as an ominous sign and evokes the dreaded “R word” as previous recessions in the US were preceded by an inverted yield curve. The standard interpretation of an inverted yield curve is that the economy will be worse off in the future than it is now which would require the lowering on interest rates further down the line to stimulate economic activity – hence the lower yield further out into the future. One could infer such a scenario playing out as the series of rate hikes that are now expected from the Fed lead to a slowdown in activity. Consumers and businesses would have to adapt to the higher cost of debt as a larger portion of their incomes or profits go towards servicing more interest rather than consumption of investment – lost economic growth.
It does seem that the Fed might be caught between a rock and a hard place as it must balance raising interest rates to tame inflation whilst avoiding a potential recession brought about by a slowdown in economic activity due to higher interest rates. It should be noted that not all inverted yield curves lead to a recession. That may be the case this time round as the current shape of the yield curve has been influenced by the Fed’s bond purchasing program. The Fed began purchasing large amounts of US government bonds during the pandemic to keep interest rates depressed (recall the inverse relationship between bond price and their yields). With the Fed winding down its bond buying program, bond prices, specifically shorter-term, are influenced to the downside and consequently shorter-term yields are likely to head up. The theory of this particular argument is that the inverted yield curve is being driven by technical factors rather than economic fundamentals. Whether or not this theory holds true remains to be seen. Currently US economic growth and jobs data do not point to a recession but the inverted yield curve, brief as it was, could still prove to be an ominous sign.
Owing to their proximity to the conflict in Ukraine as well as their relatively higher engagement with Russia in terms of trade, European equity markets have suffered more so than most. European indices such as the French CAC, the German DAX and the Netherland’s AEX Index were all down by more than 7% at the end of the quarter. Eurozone inflation reached record levels in March rising as high as 7.5% on the back of higher energy and food prices which have surged following the invasion of the Ukraine. To tackle the soaring costs of inflation, the European Central Bank (“ECB”) signaled its intent to tighten loose monetary policy by scaling back its bond buying programme. However, unlike the Fed, the ECB did not opt to raise interest rates though ECB president, Christine Lagarde, did hint that any changes to interest rates would be gradual and would come “some time” after asset purchases end.
One European equity market that has enjoyed a positive quarter is the UK. The FTSE 100 Index, a broad measure of UK equity markets, returned a little over 3% in pound terms for the first three months. One possible reason for the lack of correlation between UK and other developed markets could have been the relative attractiveness of UK stocks due to their lower valuations. Stretched valuations led investors to seek cheaper alternatives with the UK a prime location for such “bargains”. Areas for bargain hunting included the financial sector, which constitutes a “meaty” portion of the UK equity market. UK banking stocks in particular have found more favour as the Bank of England has raised interest rates three times since December last year, a move that is likely to lead to increased profits for UK banks. Compared to other major global equity markets, mining and energy stocks carry a relatively larger weighting in the FTSE 100 and equities in both sectors have benefited from surging commodity prices.
The energy sector, not only in the UK but from a global perspective, has been a standout, significantly outperforming other sectors during the quarter. Energy prices have soared following announcements by the US and UK to ban Russian oil with mounting pressure on the European Union to follow suit. Russia supplies Europe, especially Germany, with a large quota of natural gas for energy and heating purposes and while it may not produce as much oil as Saudi Arabia or the US, Russia is still a significant contributor to global oil production. It was nearly two years ago that oil prices capitulated to almost zero, in fact West Texas Intermediate (“WTI”) even fell into negative territory for a day. Since the lows brought about by the pandemic, oil prices have risen steadily as expectations of demand grew in the wake of travel restrictions and lockdowns being reduced. The Russian invasion has served as a catalyst for oil prices pushing, the price of Brent crude above $100 a barrel eventually peaking at nearly $140.
Oil prices were however pegged back somewhat as certain Opec members signaled the possibility of increasing production to alleviate supply concerns. Additionally, a fresh wave of lockdowns in China due to the growing spread of Covid-19 have created downward pressure on oil prices owing to expected weaker demand in the region. The US has attempted to apply even more downward pressure following
President Biden’s announcement that the US has released 180 million barrels of oil from its emergency stockpile and threatened to punish domestic oil companies that do not increase drilling. Despite the impact of the above, the price of Brent crude and WTI still ended the quarter higher, at $105 (+44%) and $99 (+33%) a barrel respectively.
Oil and gas are not the only commodities where Russia’s influence over global supply is noteworthy. Russia is significant producer of platinum group metals (“PGMs”), specifically palladium and to a lesser extent rhodium. Both PGMs are core components in catalytic convertors contained in internal combustion engine vehicles and during the quarter, the prices of palladium and rhodium rose 19% and 38% respectively. Electric vehicles (“EVs”) were not immune either. Russia is a large producer of high-grade nickel, a critical ingredient in the lithium-ion battery cells for most EV’s. The price of the base metal exploded during March skyrocketing above $100,000 which led the London Metal Exchange to suspend trading in the metal for a week. At the close of the quarter, the price of the metal deflated somewhat to $33,400 a tonne but still registered a quarterly gain of 60%. Other metals have also experienced sizable price increases during the quarter including zinc (+17%), tin (+12%), aluminum (+25%) and iron ore (+34%).
Another metal which seems to have regained some of its shine is gold. The yellow metal briefly rose above the $2,000 level as investors flocked to the safe haven asset following the invasion of Ukraine. Amidst political uncertainty and rising inflation, which has now been catalysed by surging commodity prices as mentioned above, bullion is believed to offer a store of value for investors. Despite trading as high as $2,074 an ounce during the quarter, the momentum could not be sustained as the Fed’s move to raise rates weakened the appeal of holding gold.
Elevated commodity prices may be one of the factors driving the strong performance of the rand. Since peaking in November last year at over R16 to the US dollar, the local currency has enjoyed a period of appreciation against the US dollar eventually closing the quarter at R14.54 to the US dollar. Other factors which are likely contributors to the rand’s resurgence include the release of South Africa’s latest budget. The figures that were released were better than many had expected, notably due to higher commodity prices, which have also played a part in South Africa’s current account surplus. One would also have to consider the relative impact of interest rate hikes in South Africa compared to its level of inflation against that of the US. Without going into the technicalities of how it is calculated in each region, South Africa’s level of inflation is below that of the US. This combined with South Africa commencing its rate hiking cycle before the US might have added to the attractiveness of the rand for investors and traders alike.
The local equity market was one of the few to experience a positive quarter as the JSE All Share Index returned close to 4% during the quarter. The performance would have been even better had it not been for the appreciation of the rand – in US dollar terms, the JSE All Share Index returned 13% for the quarter. Unsurprisingly, resource counters were the major contributors to the market’s outperformance on the back of strong commodity prices. During the quarter, the South African Reserve Bank continued with its own rate hiking cycle having raised interest rates twice already this year to bring the South African repo rate up to 4.25%. The rate is still well below its pre-pandemic levels and South Africans may have to brace themselves for further rate hikes this year. Increased interest rates and the prospect of more to come has buoyed local banking stocks. Major South African banking stocks delivered strong gains during the quarter which were further supported by their financial results that showed strong improvements compared to the pandemic era. The same could not be said for the likes of Naspers and Prosus as the pair lost close to a third of their value during the quarter.
Between them, they own close to 30% of Chinese tech giant Tencent whose shares, along with other US-listed Chinese companies came under pressure during the quarter. Renewed concerns arose over the possibility of the US Securities and Exchange Commission delisting Chinese companies from US exchanges in the event of non-disclosure of information for audit purposes. US regulators have requested sight of certain documentation from Chinese companies, a move that Chinese companies have resisted to date owing to regulations in China prohibiting the release of such information without Chinese regulatory approval.
Chinese equity markets have also had to deal with a fresh wave of lockdowns put in place as the coronavirus spreads across various regions. Chinese equities were however bolstered following news from Beijing that it would take measures to support the economy and financial markets. The move was well received by investors but it was unable to prevent China’s CSI 300 Index, a broad measure of equities that trade on the Shanghai stock exchange, from ending the quarter down by more than 13%. In Hong Kong, the Hang Seng fared somewhat better as it “only” closed the quarter down a little under 4%.


