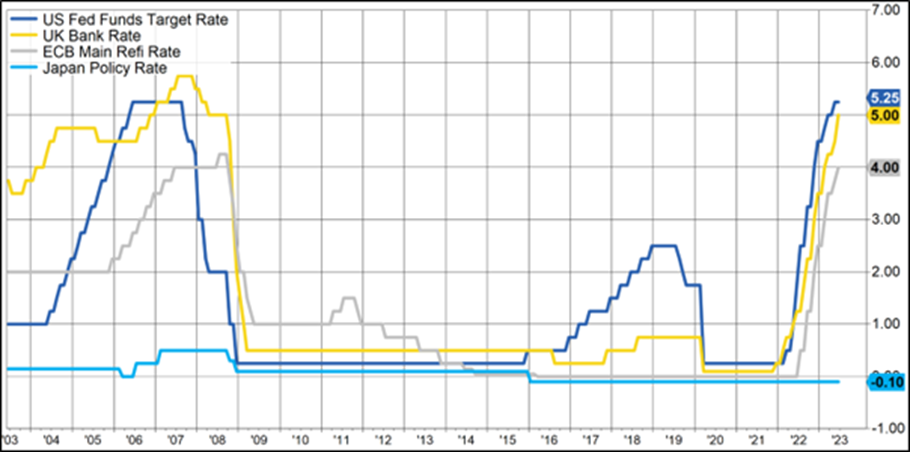
The market stand-off with central banks continued in June with equity markets edging higher in an environment of increasingly restrictive monetary policy. Central banks moved with a “hop, skip and a jump” in June as policy makers responded in their own way to their domestic inflation scenarios. The US Federal Reserve Bank chair, Jerome Powell, was adamant in his testimony to Congress recently that they had never used the word “pause” in their policy statements, but the Fed nevertheless chose to “skip” another rate hike in June. The US central bank opted rather to wait and gather more information about the health of the labour market and the economy following the dramatic increase in interest rates to date. Despite the “skip”, Powell was quick to explain that most members of his policy committee still envisioned further rate hikes in the second part of the year. Across the Atlantic, after a shocking inflation print the day before, the Bank of England’s monetary policy committee saw fit for a “jump” in rates of 50 basis points (“bp”) as opposed to the 25bp that was expected. The European Central Bank (“ECB”) hike in June was more of a “hop” as official interest rates were increased by 25 basis points, exactly as expected. Despite the variation in policy outcomes at the three central banks, the policy makers all continued to lecture the markets on the evils of inflation and the necessity for even more restrictive policy to tame the inflation beast back to 2% target levels. The sharp increase in policy rates, the fastest pace in decades, is reflected in the chart below which spans the past 20 years.
Developed market policy rates: 2003 - 2023

Source: Factset
On the flipside, inflation and growth have been very subdued in China and that situation has demanded a unique policy response. With the re-opening of the Chinese economy post the strict COVID lockdowns, much was expected from the world’s second-largest economy. The June prints of retail sales, fixed asset investment and industrial production were all weaker, with property investment down further in the month as slower economic activity was reported from various sectors of the economy. For the first time since mid-year last year, the People’s Bank of China reduced its one- and five-year lending rates by 10bp in order to provide some stimulus to the economy. The markets weren’t impressed with the small measure of policy relaxation, expecting that much more will need to be done on both the monetary policy and fiscal policy fronts to reignite the Chinese economy.
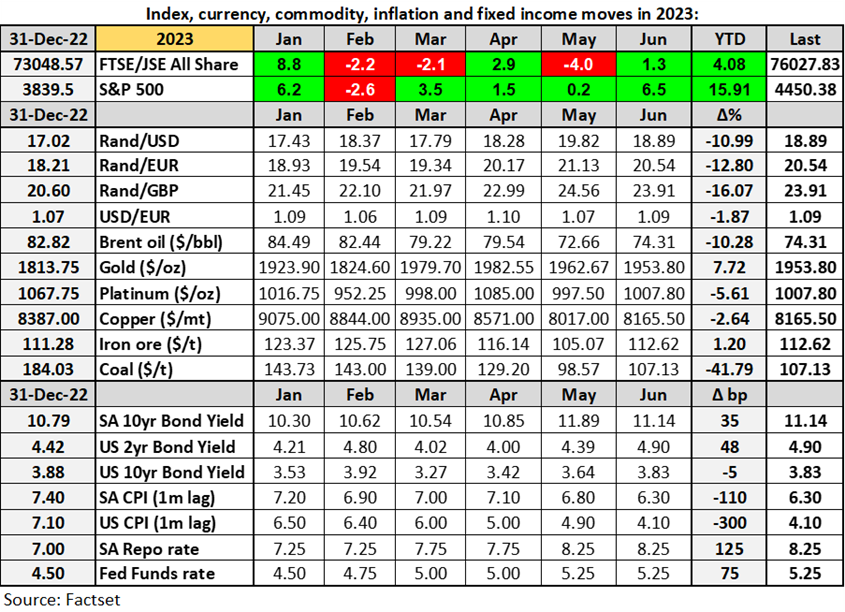
The “skip” by the Fed in the face of further tightening by the ECB saw the US dollar weaken modestly over the month against the euro to reflect depreciation of just less than 2% this year so far. At home, after the rand and bonds experienced something of a blowout in May (see table below), there was some reprieve in June with the currency gaining against the major crosses and the yield on 10-year government bonds improving by about three quarters of a percentage point. Despite the currency gains in June, the rand depreciation for the year against the developed market currencies remained of the order of 11-16%.
Commodity prices generally remained at softer levels in June as economic activity and demand continued to slow around the world and as China’s economic recovery failed to gather momentum. The oil price did trade a little higher during the month (Brent closed just above $74 a barrel) but the OPEC+ consortium will likely be disappointed with that outcome after they announced plans to cut production in order to bolster prices. Saudi Arabia announced that they will cut their own production by 1m barrels per day in July and that could provide a pricing floor for oil in the shorter-term.

The table above reflects the improving inflation trend both locally and, in the US, but the South African Reserve Bank and the Federal Reserve Bank have both continued to adopt a hawkish policy stance with inflation far from target levels. At 4.1%, US consumer price inflation is slowly edging towards the point target of 2.0% while the 6.3% consumer price inflation in South Africa remains outside of the 3-6% target range and some way from the desired 4.5% midpoint of the range. Economic indicators out of the US have been fairly resilient with a still-strong labour market. GDP data for the first quarter of the year, finalised in June, showed the economy growing at a healthy 2.1% q/q (1.8% y/y). Locally, Q1 GDP printed at 0.4% q/q which was a positive surprise but nevertheless indicative of a very weak economy. Confidence indicators for both business and households released in June for the second quarter of this year reflected a further deterioration in sentiment amongst South Africans. Weak sentiment and poor demand are reflected in the prices of many of the JSE-listed companies that operate wholly or mostly in South Africa. Apart from weaker demand for their products, these companies have also had to contend with significantly higher inflation and that has reduced margins and bottom-line profitability.
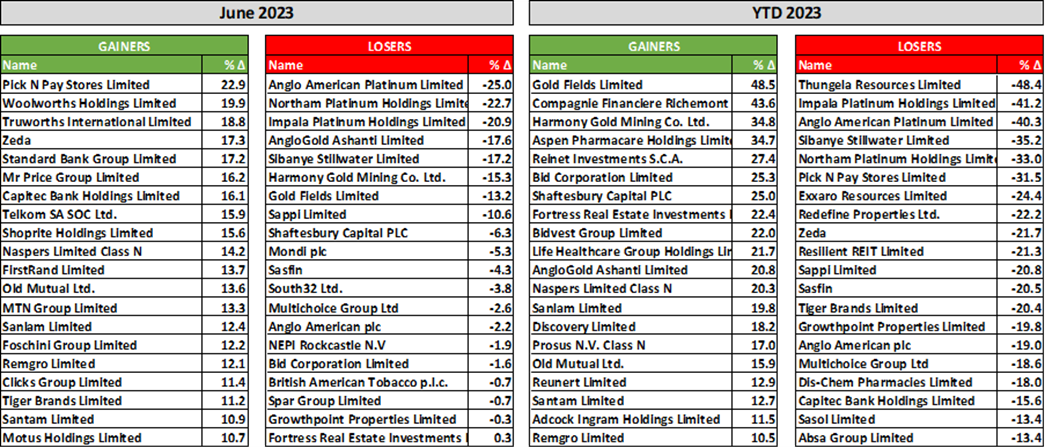
The table below reflects some of the JSE’s biggest winners and losers in the month of June and for the first half of this year. Some of the retailers and supermarkets and banks experienced something of a reprieve in June from very oversold levels but the underlying fundamentals remain weak. Pick n Pay gained almost 23% in the month but was down 27% in May and remains 31% down for the year. The precious metals miners were the biggest losers in June with the platinum miners topping the list and remaining amongst the biggest losers on the market this year. Shares of the gold miners lost between 10% and 20% in June as gold pulled back from above $2,000/oz but gold stocks remain amongst the biggest gainers in 2023 to date.
Selected winning and losing stocks on the JSE over June and 2023 year-to-date (price only):

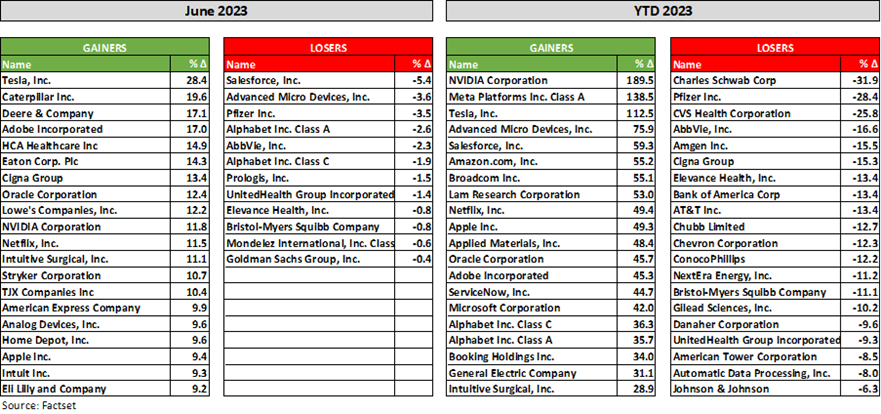
Outside of earnings reporting season for the S&P 500 companies, stock prices were driven by general market sentiment and any company-specific news that was released. For 2023 to date, technology stocks and specifically stocks related to artificial intelligence, semiconductors and cloud computing, have done extremely well (see table below). With this rush to technology growth stocks, the traditional defensive market plays have taken a back seat. The list of losers in the first half of the year is littered with pharmaceutical companies, medical technology companies and health insurance companies.
Top winning and losing stocks from the 100 largest S&P 500 companies in June and 2023:

After the first six months of this year, the S&P 500 has returned a very healthy 15.9% with the FTSE/JSE All Share Index just holding on to its meagre gain of 4.1% (or -5.9% in US-dollar terms). The American market’s gain is despite much higher interest rates and declining quarterly corporate earnings. With the earnings season for the second quarter set to kick off in mid-July, expectations are for a 6% y/y decline in earnings. From the next quarter onwards and for the year as a whole, earnings are expected to improve, with even greater growth in 2024. At this point in time, the market is focusing on the positives: a resumption in earnings growth from Q3, a peak in interest rates during the second half of this year and slowing but still positive US economic growth. The more bearish school is pointing to a sharper decline in economic activity to come, higher interest rates for a more sustained period, an overvalued equity market (and technology stock bubble), a more-attractive bond market and a slower return to corporate earnings growth than is currently being considered. It does look like earnings need to catch up with prices, but markets are forward-looking and at this point are painting a positive picture of future corporate profits. What we do know is that views on the market will chop and change as we move from indicator to indicator and as earnings results overdeliver here and underwhelm there. Shorter-term market movements are always difficult to predict and that’s why investment is always and everywhere a pursuit for the longer-term.