Monthly economic and market review: December 2023
As we wrapped up the financial narrative of 2023, the year-end rally stood out as a beacon of optimism, steering the markets to a positive conclusion amid persistent concerns.

As we wrapped up the financial narrative of 2023, the year-end rally stood out as a beacon of optimism, steering the markets to a positive conclusion amid persistent concerns. December witnessed positive gains, painting an encouraging picture for both the FTSE/JSE All Share index and the S&P 500 index, as demonstrated in the graph below. The FTSE/JSE All Share index displayed resilience throughout the year, achieving a 5.26% gain year-to-date. It navigated a series of peaks and valleys, reaching its zenith at 80,791 points on January 27th and experiencing a low point of 69,451 points on October 27th. Concluding the year at 76,893 points on December 29th, securing a 1.8% gain for the month.
Meanwhile the S&P 500 index displayed remarkable growth, posting a significant gain of 24.23% for the year. This impressive recovery comes after a challenging 2022, during which the index experienced a notable decline of 19.44%. Hitting its peak on December 28th at 4,783 points, the index briefly dipped to 3,808 points on January 5th. Closing December at 4,769 points, reflecting a solid 4.4% gain. This impressive recovery serves as a testament to the market's resilience and adaptability.
FTSE/JSE All Share index (Blue, RHS) and S&P 500 index (Green, LHS) in 2023

Source: FactSet
Despite a challenging third quarter earnings season, the US stock market closed the year on a positive note. Investor sentiment fluctuated throughout the year, starting with optimism about easing inflation but shifting to concerns about rising interest rates and a possible economic slowdown. Despite a positive end to 2023, substantial uncertainties persist, such as the trajectory of inflation, the speed of interest rate cuts, and the potential for a global recession.
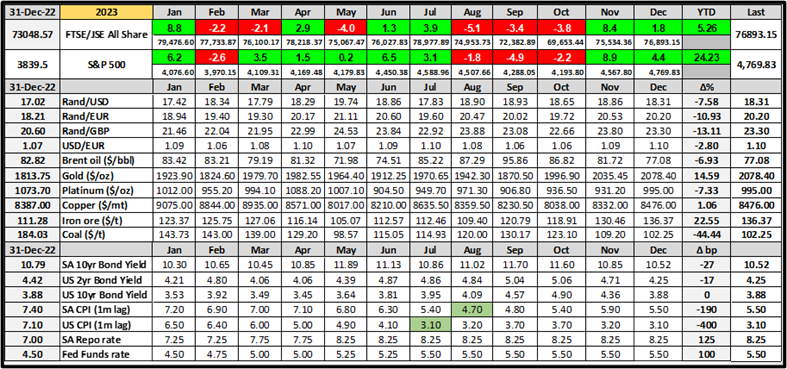
The US Consumer Price Index (CPI) for November, published in December, stood at 3.1%, showing a slight decrease from the 3.2% reported in the prior month for October. With it consistently staying below the 4.0% mark. Consequently, the target of the Federal Funds rate, which had been increased by 25 basis points to 5.50% in July, has been left unchanged since then (see chart below). Similarly, the CPI in South Africa reached its highest point at 7.8% in July 2022, subsequently declining to a low of 4.7% in July 2023. The most recent data, published in December, indicates a CPI of 5.5% in November. Additionally, the South African Reserve Bank last adjusted its policy rate in May, implementing a 50 basis points increase to 8.25%. Since then, the repo rate has remained unchanged.
The table provided below outlines the monthly fluctuations in the US and South African equity and bond markets throughout 2023, accompanied by the monthly movements in selected commodity prices, currencies, inflation rates, and central bank policy rates.
Index, Currency, Inflation, and Fixed Income moves in 2023:

Source: FactSet
The noticeable shift in market sentiment regarding the Federal Reserve Bank's future actions is evident in the substantial changes observed in the yields of US Treasuries throughout December. The 10-year treasury yield experienced a significant decline of 48 basis points, moving from 4.36% to 3.88%, while the two-year treasuries' yield saw a decrease of 46 basis points, moving from 4.71% to 4.25%.
Despite historical instances of premature anticipation of a 'policy pivot' leading to market disappointment, there is growing confidence that the Federal Reserve will implement interest rate cuts in 2024. The prevailing expectation is for approximately 100 basis points of cuts throughout the year, with the potential for the process to begin as early as March. This sentiment closely mirrors expectations in South Africa, where a similar anticipation exists. Even though South African bond yields have declined in alignment with those in the US, the market envisions at least 100 basis points of cuts domestically, with the possibility of commencement before mid-year 2024.
Moving on, the US dollar concluded the year with a decrease of approximately 2.8% against the euro. In December, the closing level of the US dollar was $1.10/€, slightly up from $1.09/€ in November. Anticipations surrounding interest rates persisted, with expectations of continued increases. However, after initiating an assertive rate-hiking cycle in early 2022, the Federal Reserve is now anticipated to commence easing in early 2024. This shift in monetary policy is driven by indications that inflation in the US is showing signs of cooling down.
Gold Price ($/ozt) movements in 2023:

Source: FactSet
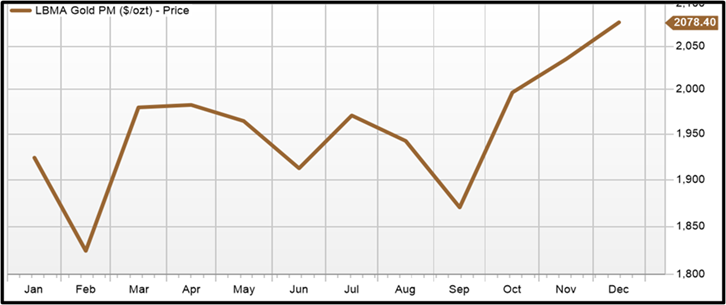
Gold closed the year at approximately $2,078 per ounce, marking a notable climb of around 14% throughout the year. This performance represents its most robust showing since 2020 and includes reaching a new record high during the year. The primary drivers behind this upward trajectory were expectations that major central banks would initiate interest rate cuts early 2024. Additionally, heightened geopolitical tensions in the Middle East, coupled with the prospect of a prolonged conflict in Gaza, further fuelled safe-haven demand for gold.
Crude Oil Brent ($/bbl) movements in 2023:

Source: FactSet
Crude oil closed 2023 approximately 7% lower due to concerns about increasing global crude supplies and slowing demand growth. Throughout the year, oil prices experienced temporary increases driven by factors such as OPEC+ production cuts, the Israel-Hamas war, and expectations of interest rate cuts from the US Federal Reserve. However, the persistent signs of rising crude production, especially from non-OPEC countries, along with an uncertain demand outlook, contributed to the overall decline in oil prices. In December, additional challenges emerged, including Angola's unexpected departure from OPEC, vessel attacks by Houthi rebels disrupting trade in the Red Sea, and the potential for prolonged conflict in Gaza.
The table below highlights some of the JSE's significant gainers and losers in both the month of December and the year 2023.
Selected winning and losing stocks on the JSE over December and 2023 year-to-date (price):

Source: FactSet
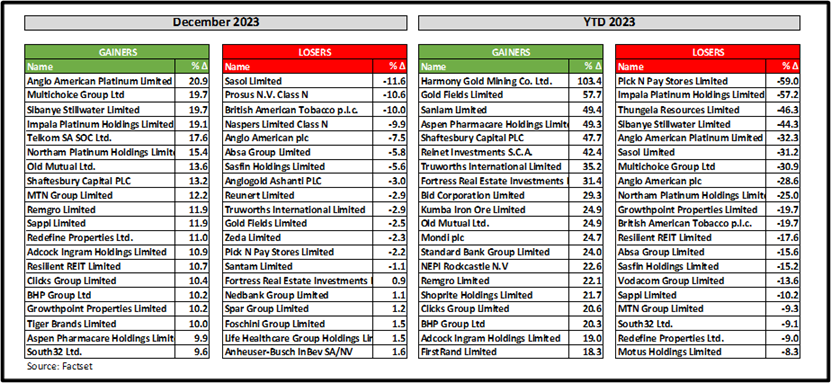
In December, platinum miners experienced a notable upswing, with Anglo American Platinum leading the pack with a gain of 20.9%. This positive momentum was fueled by an increase in platinum prices, averaging $995 per ounce during the month, although still remaining below the $1000 mark. Other platinum miners, including Sibanye Stillwater (+19.7%), Implats (+19.1%), and Northam Platinum (+15.4%), also posted impressive gains. Multichoice also saw an uptick (+19.7%). The market gains were widespread, spanning various sectors such as selected resource stocks, financials, insurers, telecommunications companies, retailers, health care, food producers, and real estate companies. These sectors comprised the top 20 performers in December. Despite the positive closing performances in December, all these shares (listed above) concluded 2023 with overall losses.
Platinum miners had a challenging year, emerging as the biggest losers. This can be largely attributed to the impact of a global economic slowdown, which reduced the demand for platinum group metals (PGMs), particularly platinum, palladium, and rhodium. The decline in demand, especially in the automotive and industrial sectors, resulted in a noticeable drop in PGM prices. In the same month, underperforming stocks faced specific challenges. Sasol (-11.6%) experienced a significant decline, primarily linked to the drop in oil prices during December.
Naspers (-9.9%) and Prosus (-10.6%) also underwent a pullback, retracing from their robust performance in November. The decline was attributed to the impact of new Chinese tech regulations, specifically those affecting Tencent. Beijing has been actively addressing concerns related to gaming addiction and its perceived link to the rise of myopia among youths. In response, the government wants to discourage high spending in online gaming by banning the use of rewards to encourage regular logins. This move resulted in a significant drop in the Tencent share price, which, in turn, influenced the decline in Naspers and Prosus share prices in the month of December.
In the gold sector, prices continued their ascent in December, averaging $2078.40 per ounce. This propelled Harmony and Gold Fields to the top performers for the year 2023, with Harmony Gold ending the year up 103.4%, and Gold Fields closing with a gain of 57.7%. Sanlam secured the third position, closing the year with a 49.4% gain. Meanwhile, Pick n Pay had a challenging 2023, emerging as the biggest loser with a share price plummet of 58%, marking its second-worst year on record after 2008. The year began on a high note but ended on a low, reaching a low share price of ZAR 20.30 on December 18th after peaking at ZAR 62.51 on January 19th. This journey from a great start to a less-than-ideal ending was characterised by various challenges, including rising inflation, increased operating costs impacting margins, and significant leadership changes, notably the loss of founder Raymond Ackerman and the return of Sean Summers as CEO.
The table below highlights some of the S&P 500's significant gainers and losers in both the month of December and the year 2023.
Selected winning and losing stocks from the 100 largest stocks on the S&P 500 over December and 2023 year-to-date (price):

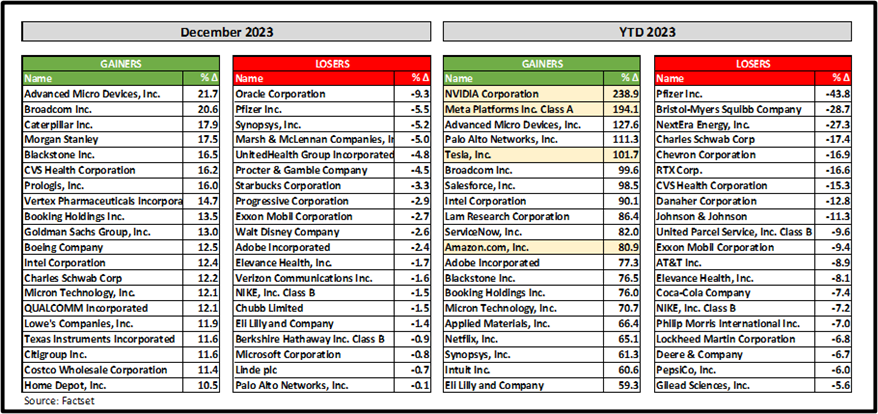
Notably, in the S&P 500, AMD stood out as the top performer, experiencing a substantial increase of 21.7% in December, followed by Broadcom (+20.6%) and Caterpillar (+17.9%). Financial institutions also demonstrated impressive performance, with Morgan Stanley (+17.5%), Blackstone (+16.5%), Goldman Sachs (+13.0%), and Citigroup (+11.6%) achieving noteworthy gains. However, pharmaceutical, and medical technology sectors faced challenges in 2023, particularly due to the impact of new weight loss drugs. Pfizer recorded the most significant decline of the year, dropping by 43.8%, while Johnson & Johnson also saw a decrease of 11.3%. On a positive note, Eli Lilly (+59.3%) secured the 20th position on the list of the most significant gainers.
Remarkably, four of the “Magnificent Seven” stocks are among the top 20 gainers in 2023 (highlighted in yellow above), with Alphabet (+58.8%), Microsoft (+56.6%), and Apple (+48.2%) displaying their own remarkable performances. Nvidia closed the year as the biggest gainer, marking an extraordinary surge of 238.9%, while Meta secured a notable gain of 194.1%. AMD claimed the third spot with an impressive 127.6% increase. This remarkable performance vividly illustrates the pervasive influence of technology, fuelled by generative AI, as evident in the year-to-date gainers list for 2023. As we anticipate the trends of the upcoming year, the narrative set by these tech giants, empowered by generative AI, promises to be a compelling force in shaping the ever-evolving financial landscape.