The first estimate of US real GDP growth for the second quarter of 2018 was a quarter-on-quarter (QoQ) seasonally annualised rate of 4.1%, and quarter one real GDP growth was revised up from 2.0% to 2.2%. This is the first reading well above the 2%-2.5% growth trend for the past few years. As to be expected, President Trump hailed the data as evidence that his policies on trade, taxes and other issues were working.
US real GDP growth rose 2.8% year-on-year (YoY) – growth not seen since 2015, and close to the Trump administration’s target of 3.0%. The average growth in this expansion cycle has been 2.2%, and the US Fed’s longer run growth estimate is 1.8%.
In late July, the US Commerce Department released comprehensive GDP revisions going back decades. These revisions showed a higher household-saving rate than previously reported, as well as faster growth in the first quarter of recent years. The revision did not, however, alter the overall assessment of the US economy’s structure or performance.
Underlying demand in the US economy measured by final sales to private purchasers – which excludes trade, inventories and government outlays – expanded 4.3%, a pace not seen since 2014. Consumer spending is being driven by a robust labour market and high consumer confidence, shrugging off higher gasoline prices and sluggish wage growth. The tax cuts appear to be boosting consumer spending rather than capital spending. Consumer spending, which accounts for about 70% of US GDP, expanded 4.0% and contributed 2.69% to real GDP growth in Q2:2018. Within personal consumption expenditure, goods contributed 1.24% and services 1.46% of real GDP growth.
There were several once-off factors which provided an extra boost to Q2:2018 real US GDP growth. The most obvious one is the boost to net exports despite a stronger USD. This came about because of pre-emptive purchases by foreign buyers of US goods, before the Trump administration’s tariffs and retaliatory tariffs took effect in early July 2018. The United States slapped 25% duties on $34bn worth of Chinese goods effective July 6, provoking a similar response from Beijing, which targeted soybeans and other agricultural products, as well as US-made cars. The soybean boost is likely to reverse in the coming quarters, and the fiscal stimulus is seen fading in 2019.
“Consumer spending is being driven by a robust labour market and high consumer confidence, shrugging off higher gasoline prices and sluggish wage growth.”
Will interest rates continue to rise?
With US inflation on target and the labour market very tight, it is difficult to see the Fed move away from its announced policy rate trajectory. As the Fed raises its policy rate, the US real GDP growth rate is expected to slow toward the
longterm equilibrium rate. The Fed is raising its policy rate, but the relative accommodation or tightness of the policy rate is judged relative to the neutral rate, which is unobservable and can only be estimated.
The long end of the yield curve is being held down by de-risking and strong pension fund buying. The Fed is also effectively applying an operational twist (deliberate manipulation of the Treasury yield curve) to hold down the longer end of the yield curve, so several technical factors are holding down yields at the long end of the curve.
In addition, the spreads between long end yields of the US, and other developed market yield curves, remain attractive for foreign investors. Under normal conditions, longer rates tell investors and central banks something about the longer run neutral rate. The slope of the yield curve is an important measure as to whether the central bank is adjusting short-term rates by too much or too little. In the long run, the 10-year yield is assumed to approximate nominal GDP growth.
Yield curve likely to steepen
Changing imperatives dictate a change in the central bank’s yield curve control. In Q4:2018, the Fed’s QE will reverse into quantitative tightening (QT), which will reduce the liquidity which has inflated the US bond market. Quantitative tightening looks likely to begin in the EU by the end of 2018. Even the Bank of Japan is talking about allowing higher longer end yields to improve bank margins and boost inflation. This relative change, together with greater US bond supply, is likely to steepen the long end of the US curve.
Building alliances one BRIC at a time
The BRICS Leaders’ Summit is convened annually for discussions around political and socio-economic co-ordination, where member countries have identified business opportunities, economic synergies and areas of co-operation.
The latest BRICS Summit took place in late July 2018 in Johannesburg, with President Xi Jinping of China, Prime Minister Narendra Modi of India, Russia’s President Vladimir Putin, Brazil’s President Michel Temer and South Africa’s President Cyril Ramaphosa in attendance. Other national leaders also attended the Summit.
The BRIC group held its first Summit in 2009, and South Africa joined the organisation in 2010, at which time the acronym was expanded to BRICS. Since that time, not only has the global order undergone a seismic shift, but the role of ‘bloc’ has evolved.
Increasing institutionalisation has formalised the bloc’s operations, resulting in greater measurability and transparency. The exponential institutional development of BRICS has yielded institutions including the New Development Bank (NDB), the Africa Regional Centre (ARC), and the Contingent Reserve Arrangement (CRA), among others. These are very young institutions, so measures of effectiveness will be the capacity to deliver on-key objectives, and the effective use of its “soft power” in international relations, employing the use of economic or cultural influence.
“The BRICS mechanism seeks an equity system of global political and economic collaboration, and while qualitative measures can be equal, the quantitative measures cannot."
The BRICS mechanism seeks an equity system of global political and economic collaboration, and while qualitative measures can be equal, the quantitative measures cannot.
The BRICS mechanism is seeking to distinguish itself as an equitable system of global political and economic collaboration. The qualitative measures can be equal, but not the quantitative measures. Simply there are huge differences in size of population, GDP, savings and growth rates among its members, which dictate that the quantitative measures will never be equal.
Each of the BRICS have very different political dynamics and global roles, especially China and India, given their population sizes, and Russia given its erstwhile global power role. By contrast, Brazil and South Africa represent their respective continents.
According to the International Monetary Fund (IMF) latest World Economic Outlook, China’s current USD-based GDP for 2018 is forecast at $14,093bn; Brazil at $2,139bn; India at $2,848bn; Russia at $1,720bn and South Africa at $347bn. The BRICS group has a combined USD-current price GDP of $21,170bn equivalent to 24% of world GDP, and is expected to generate 34% of the world’s current price GDP growth in 2018. The five BRICS countries account for 40% of the world’s population.
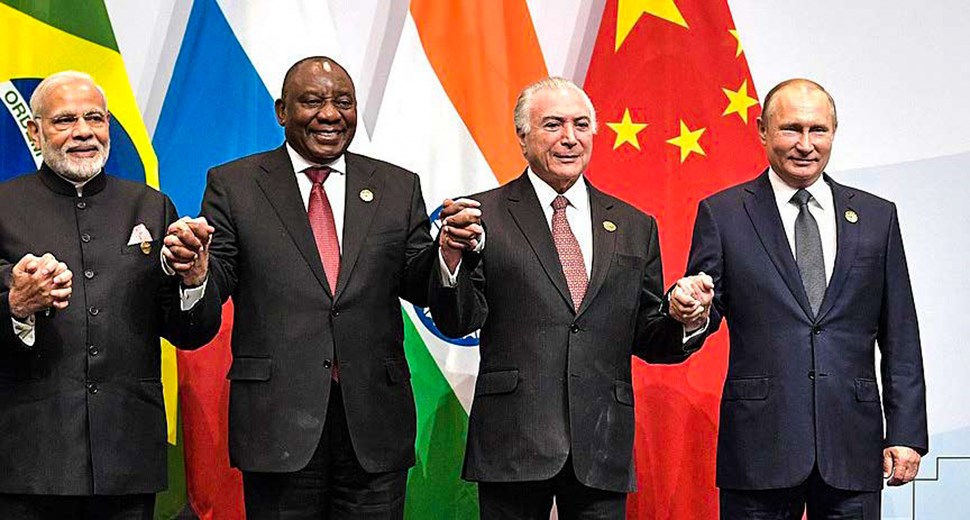
From left: Xi Jinping (President of China), Navendra Modi (Prime Minister of India), Cyril Ramaphosa (President of South Africa), Michel Temer (President of Brazil), Vladimir Putin (President of Russia).
South Africa as a net benefactor
At this point, South Africa is a net benefactor of the BRICS mechanism for two main reasons. Firstly, South Africa receives net investment inflows from the BRICS members, and secondly it can source product and capital that it cannot get from anywhere else. The expanding relationship between the BRICS members is also facilitating the diversification of trade.
The BRICS bloc is becoming an important mechanism for South Africa, positioning itself in a world order which is undergoing fundamental change. South Africa’s key priority is to cement its place in BRICS bloc. The world is changing, and South Africa needs to change with it.